
What you get
Unified GA4 + Search Console views, weekly summary (in-app), optional weekly email delivery, and actionable alerts.
SiteMetricz • Product Demo
SiteMetricz is built for solo webmasters and affiliate site owners who need clear weekly reporting: KPI deltas, trend charts, weekly summaries, and landing-page insights tied to GA4 + Search Console.
Solo webmasters running 1–10 sites get a weekly “what changed + what to fix” report without living in dashboards.
Every visual on this page uses seeded demo/example data only — never customer data.
Unified GA4 + Search Console views, weekly summary (in-app), optional weekly email delivery, and actionable alerts.
Solo webmasters and affiliate site owners running 1–10 sites who need a clear weekly action plan.
Catch traffic drops before revenue drops, know what to update this week, and spot winners/losers fast.

Step 1
Map each domain to one GA4 + one GSC property so reporting ownership stays clear.
Step 2
Get scheduled updates with explicit comparison windows and visible trend movement.
Step 3
Use winners/losers, landing pages, and weekly summaries to decide what to fix next.
What clients see day to day, explained section by section
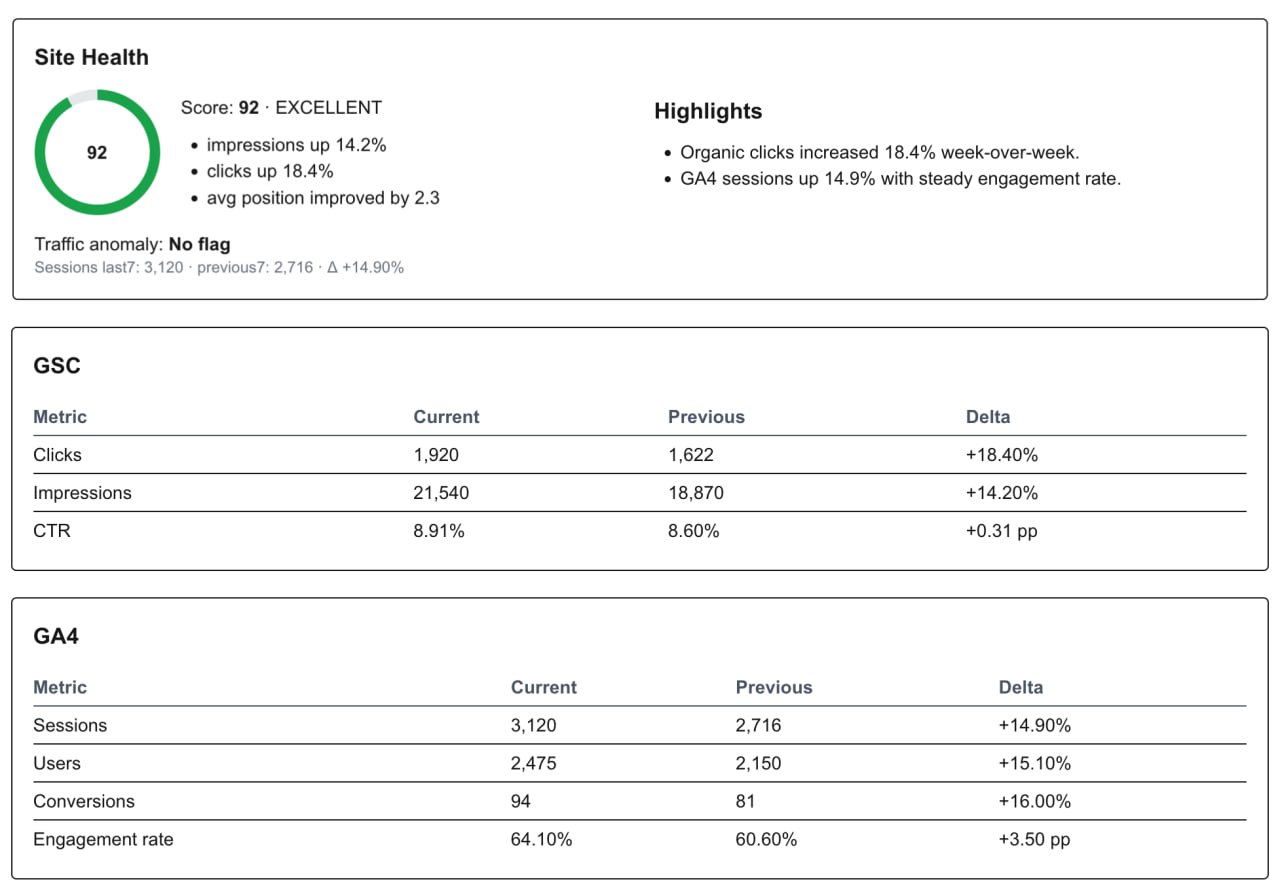
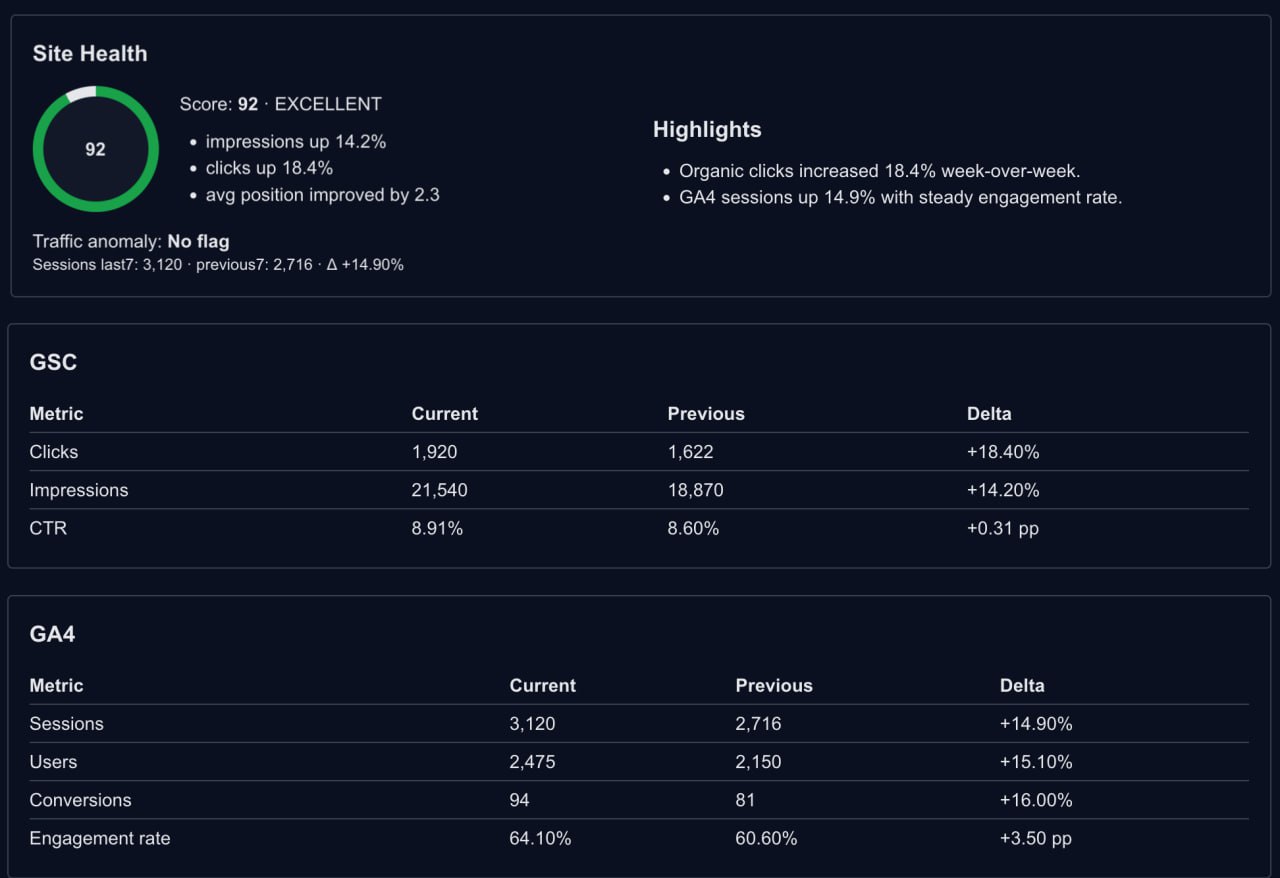
Executive weekly summary with highlights and baseline comparisons, ready for solo owner review.
Operational outcome: Weekly reviews become repeatable and consistent because the same structure is generated every cycle.
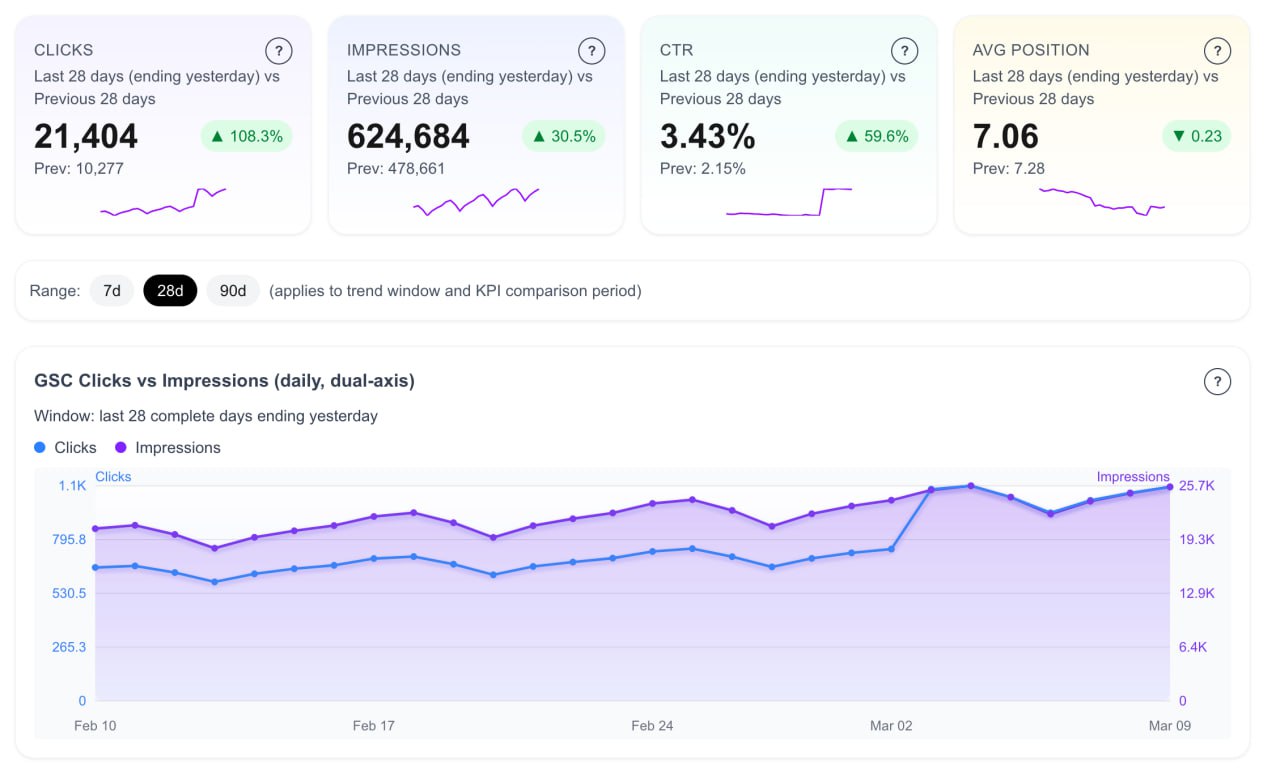
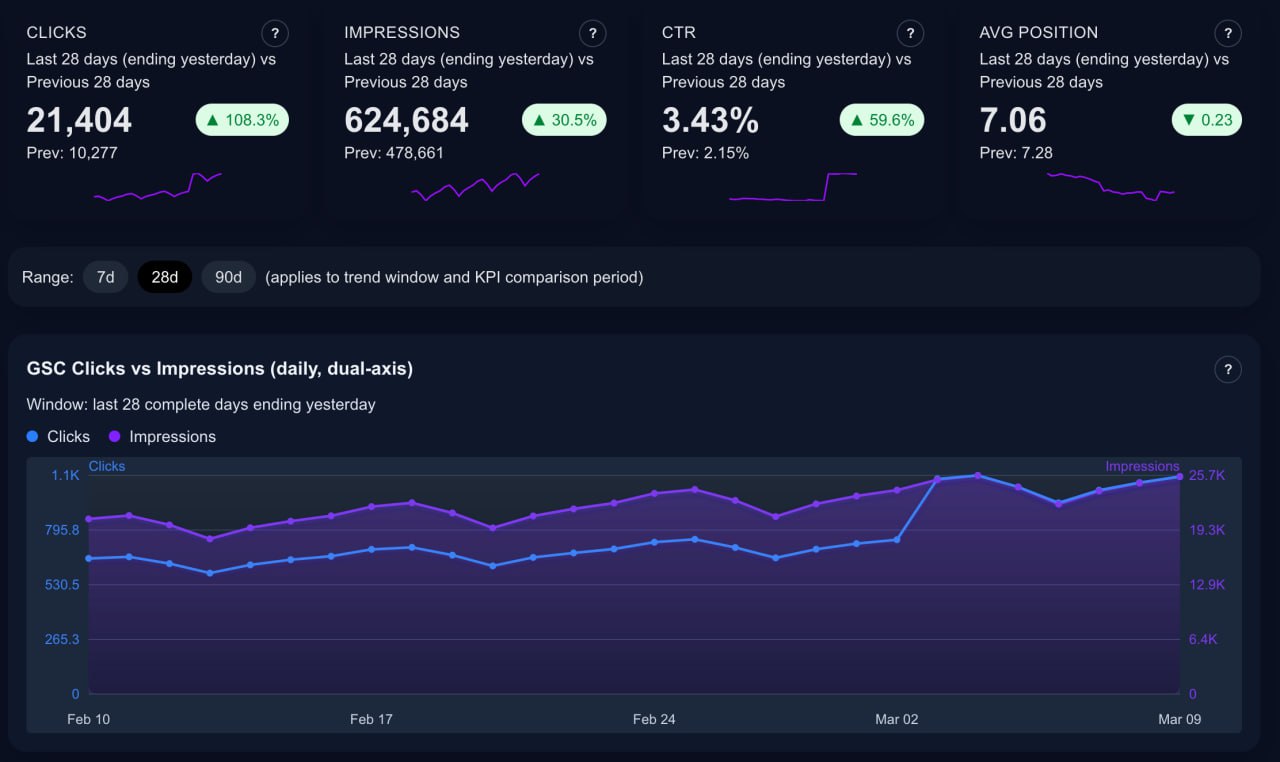
Instantly see clicks, impressions, CTR, and average position with explicit windows and trend context.
Operational outcome: You can separate discoverability issues from conversion issues in under a minute and assign the right next action.
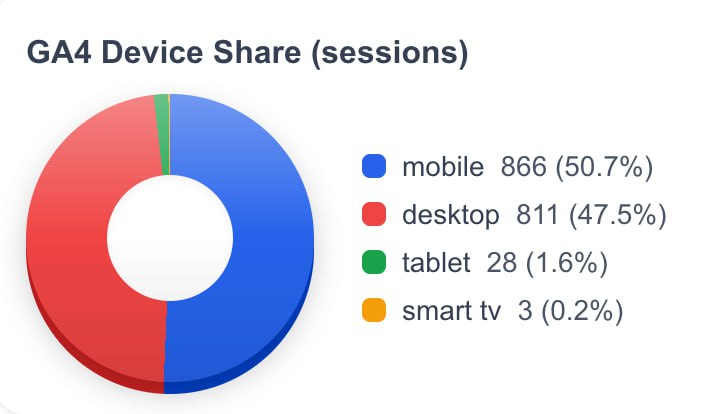
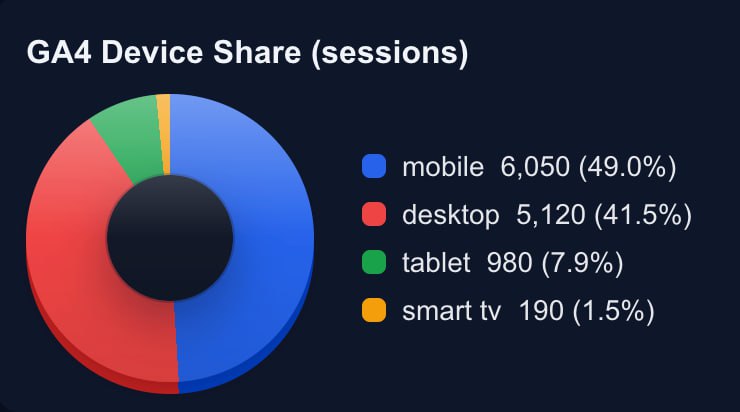
Know exactly how session mix shifts across mobile, desktop, and tablet.
Operational outcome: Device-mix changes become visible early, so UX and conversion optimization can stay proactive.
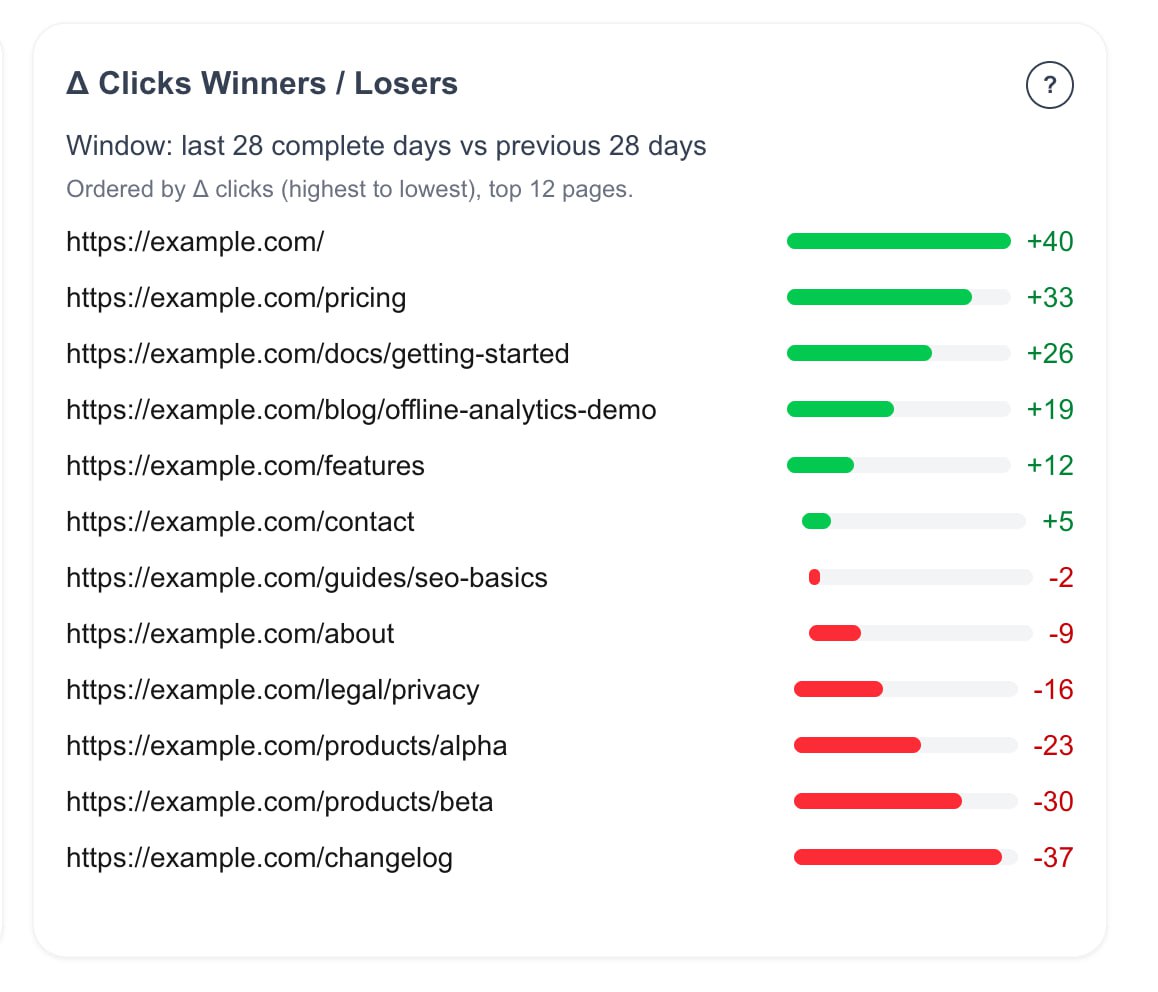
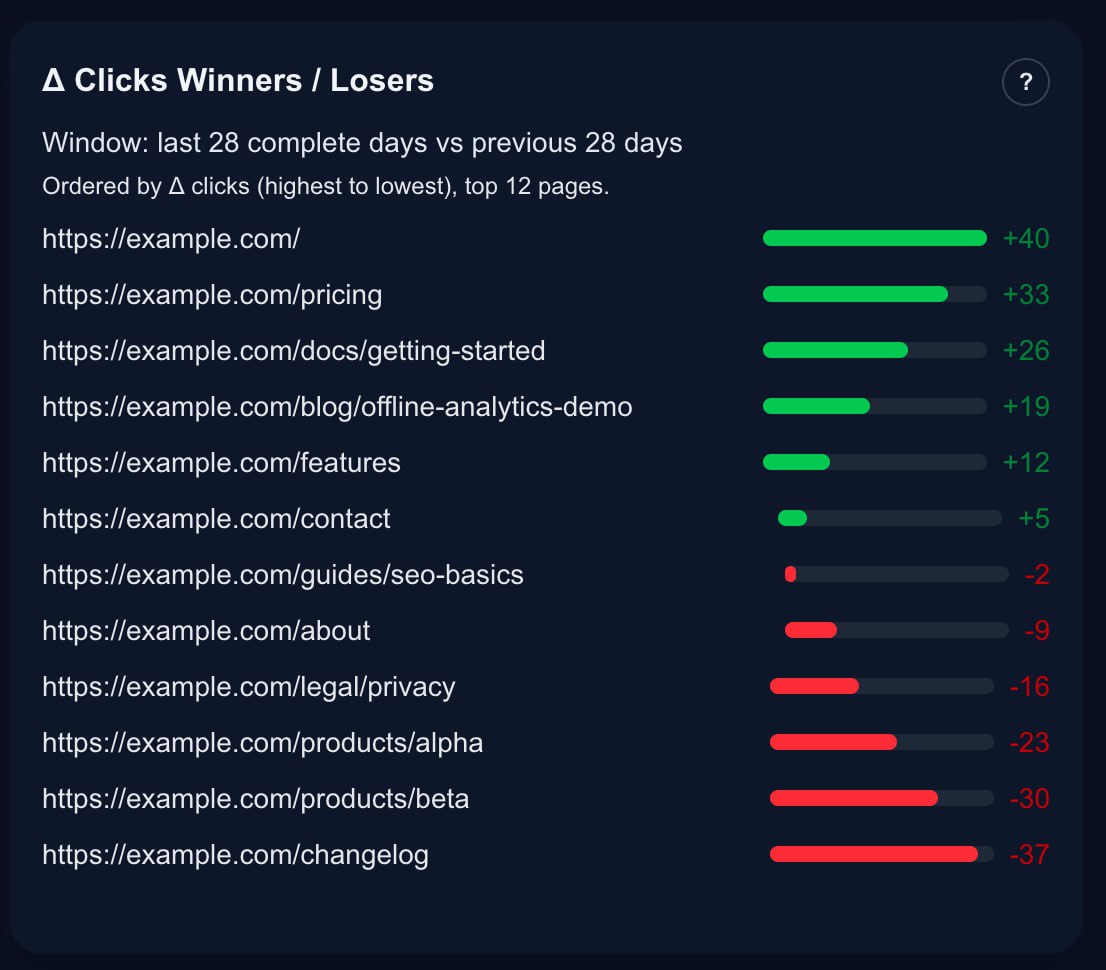
Spot page-level momentum quickly with click delta bars, so you know what to protect and what to fix.
Operational outcome: Weekly momentum monitoring helps you protect gains early and recover losers before they become costly.
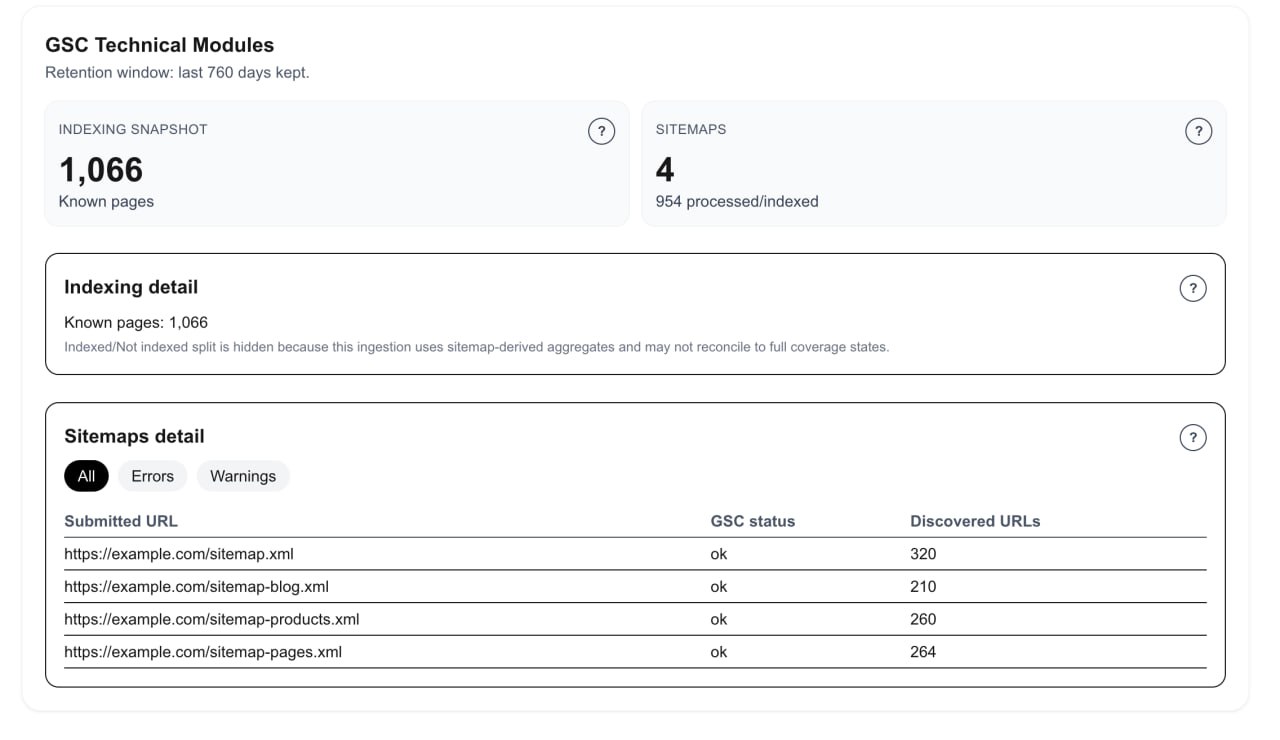
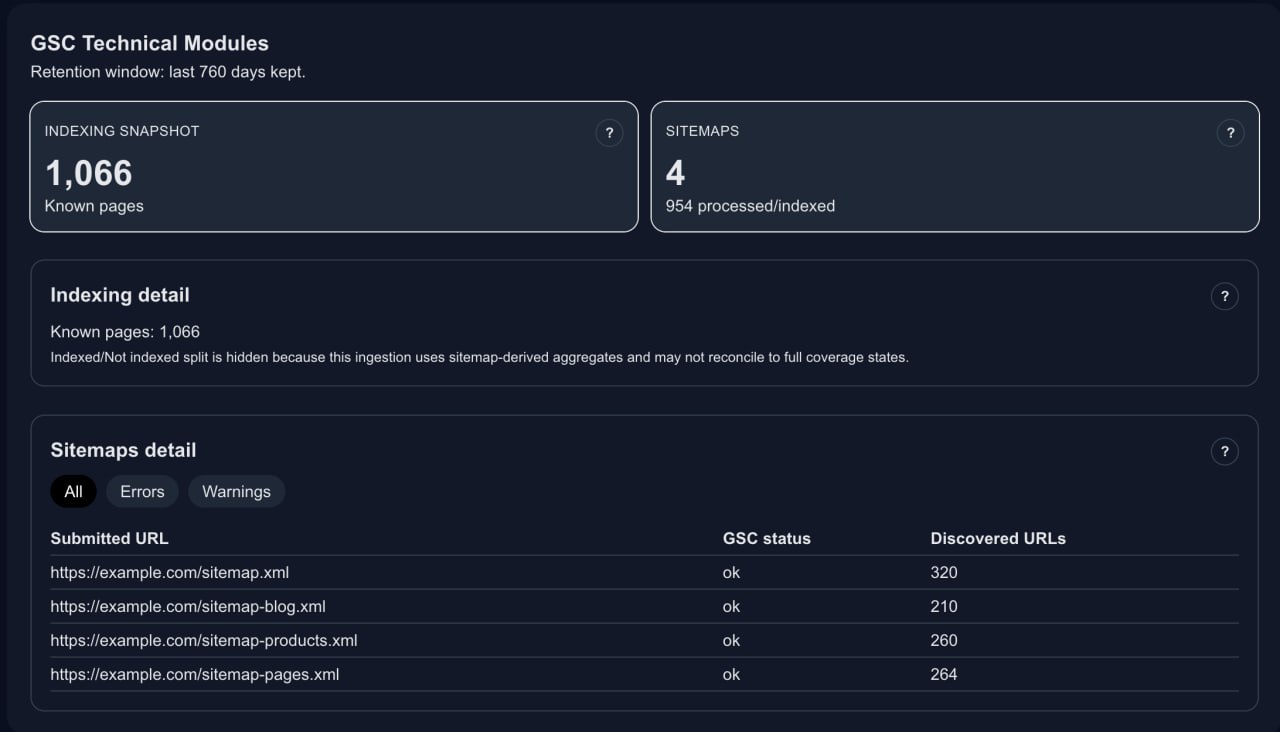
Indexing and sitemap health in practical, operational views—without unsupported API fluff.
Operational outcome: You can spot indexing/sitemap drift quickly without jumping between multiple tools.
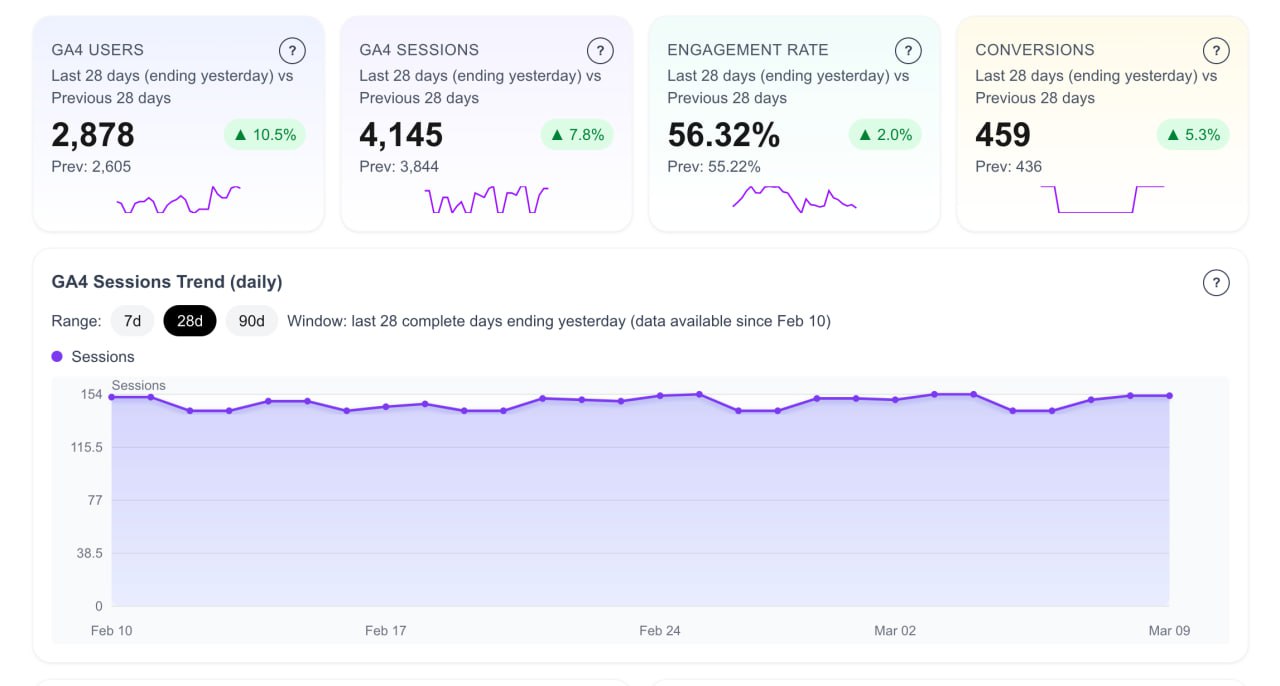
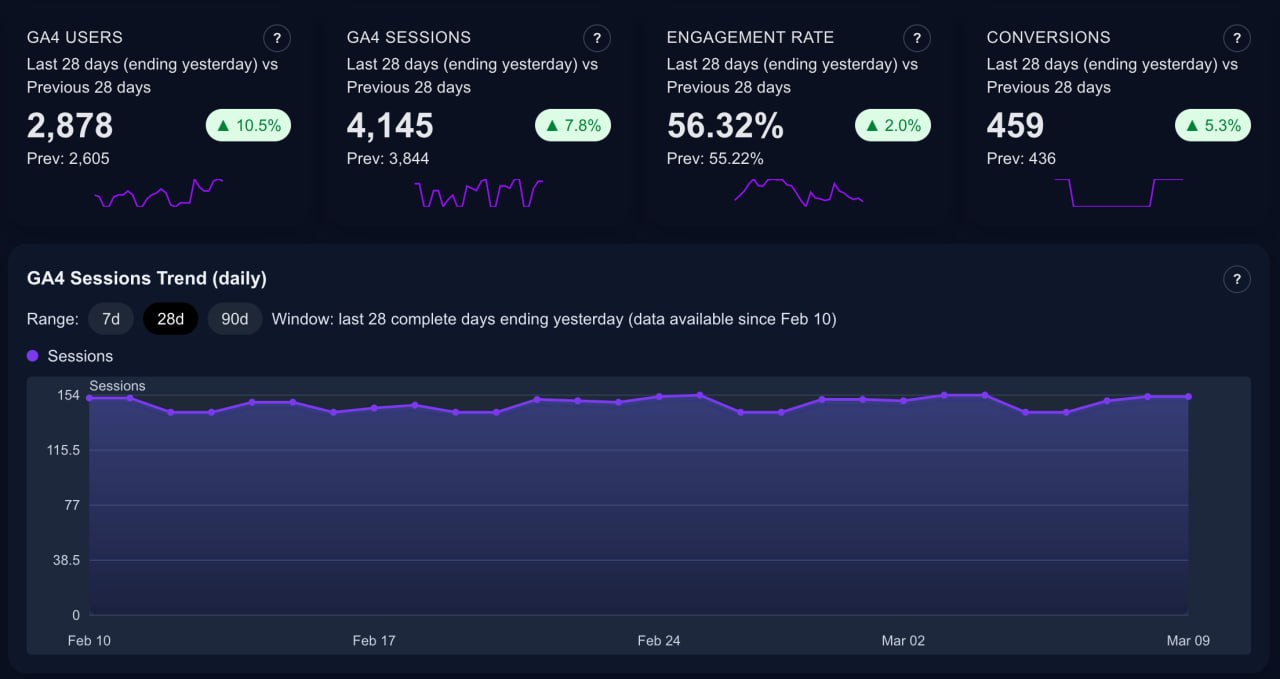
Users, sessions, engagement rate, and conversions with clear deltas and session trend over time.
Operational outcome: Teams get a shared view of traffic quality and business impact, so decision-making moves faster and with less debate.
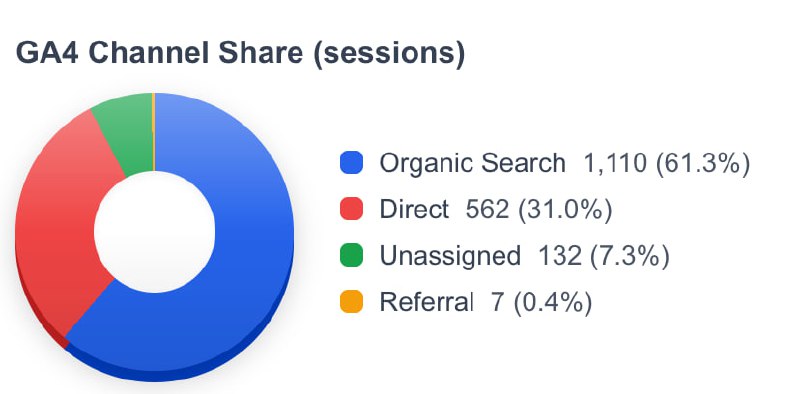
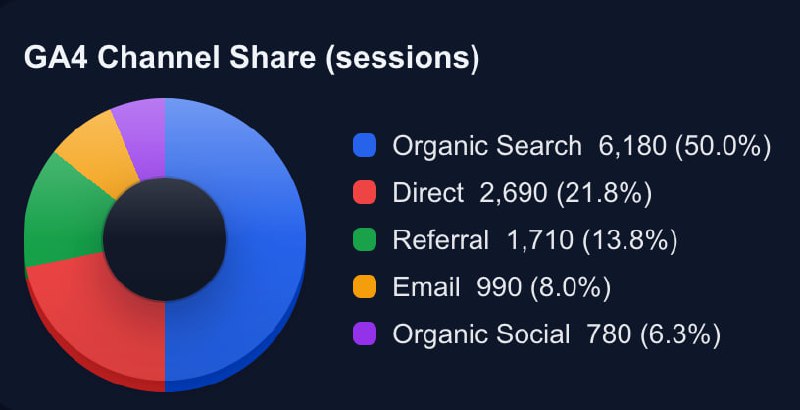
Track organic, direct, referral, and other channels in a simple executive view.
Operational outcome: Channel mix visibility makes budget and execution conversations more objective and less reactive.
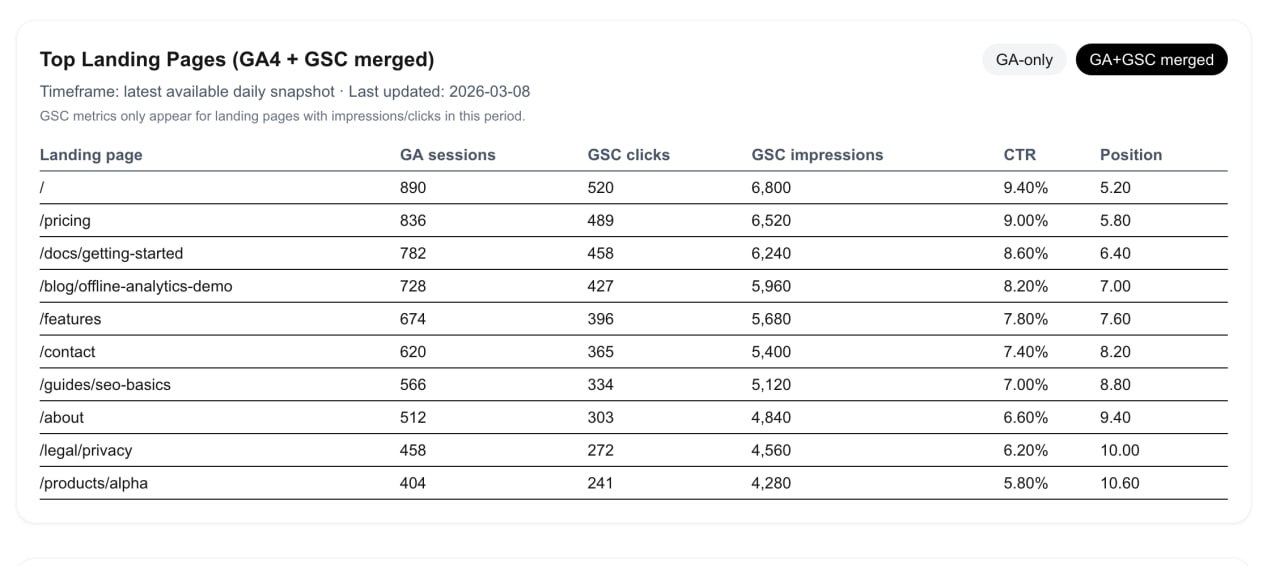
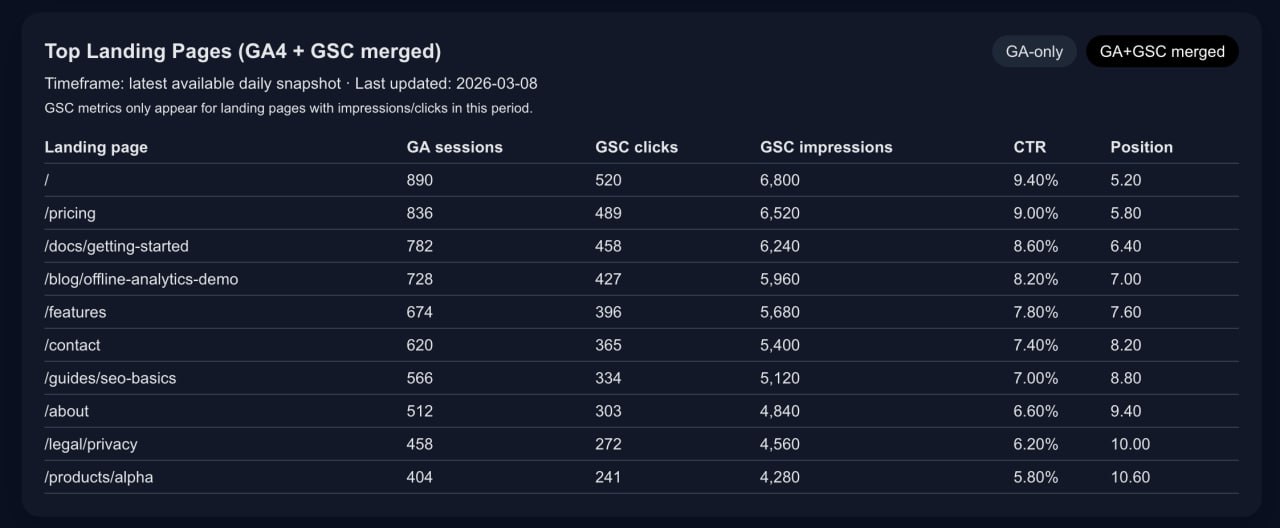
See session demand and search visibility side-by-side per landing page to prioritize what to improve next.
Operational outcome: You can prioritize pages with the biggest upside by combining demand and engagement signals in one table.
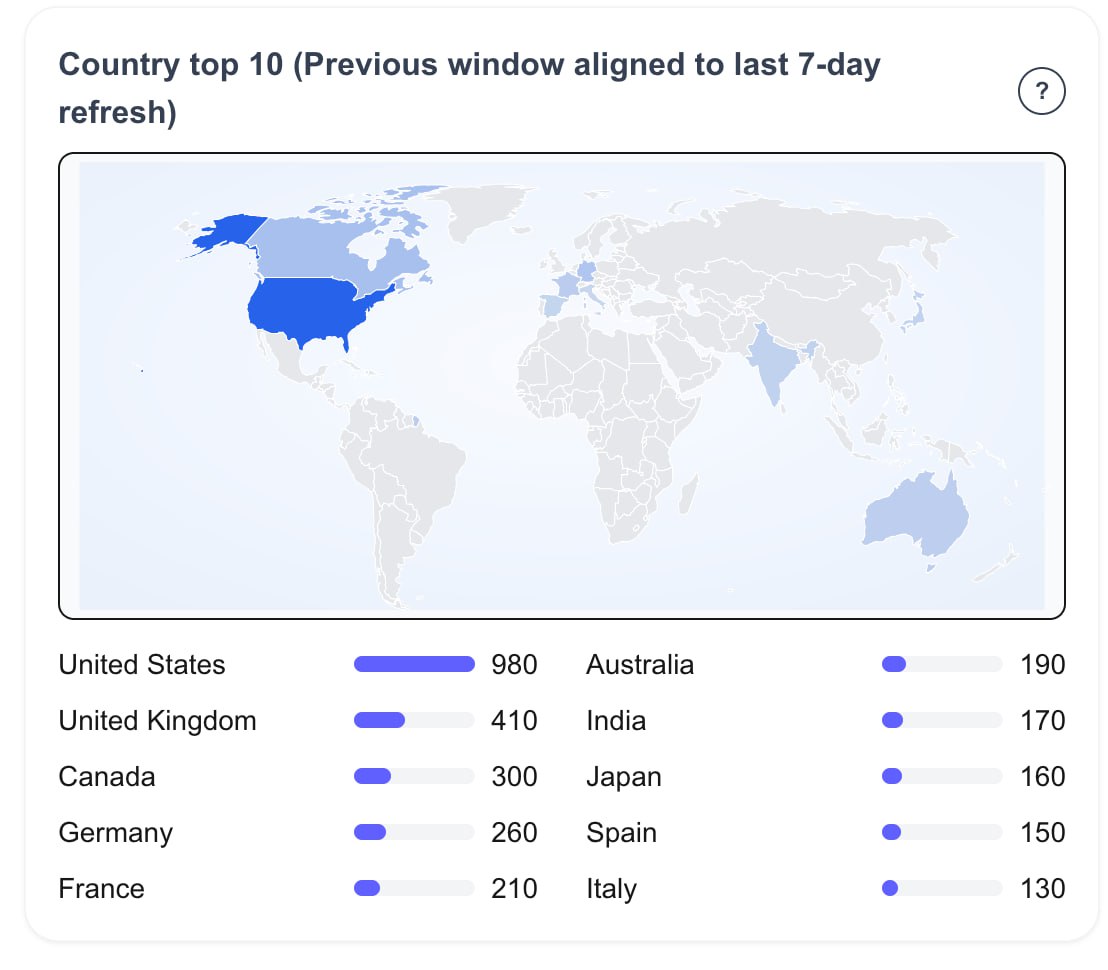
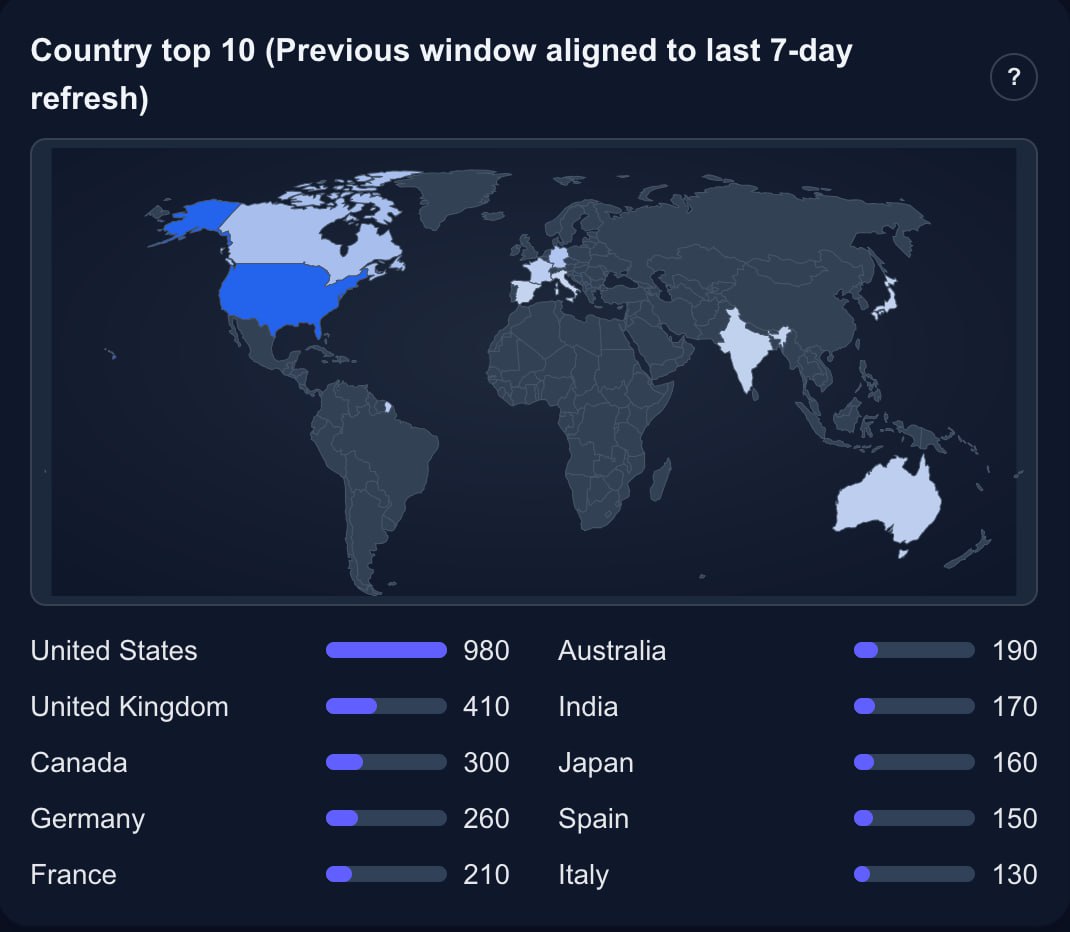
Understand where traffic comes from and which audiences/channels drive growth.
Operational outcome: You can localize growth plans using country-level performance context, not assumptions.
Cross-source KPI cards and trendlines that align acquisition, engagement, and conversion outcomes.
Create and store weekly summaries directly in the app, with optional weekly email delivery.
Priority alerts for significant drops/spikes so you can act faster than monthly reporting cycles.
Current support includes crawl/index visibility, metadata checks, and performance-oriented health indicators.
1 site = 1 GA4 property + 1 Google Search Console property.
Single-site visibility and essential KPI tracking for solo webmasters.
Multi-site reporting with richer weekly workflows and broader alert coverage.
Full demo feature set, advanced visibility modules, and complete executive-style reporting views.
No. The demo is seeded/sample data only. No customer analytics data is shown on public demo pages.
One site means one domain mapped to one GA4 property and one GSC property.
Daily means scheduled refreshes every day (or twice daily on higher tiers), with explicit current vs previous windows and weekly summaries.
No. SiteMetricz is provided as a managed product. You connect your own GA4 and Search Console properties, and we handle the application operations.

Plain-English definitions you can act on.
How many times people clicked your site from search results.
Why it matters: Direct signal that your pages are winning attention.
How many times your pages appeared in search results.
Why it matters: Shows search visibility even before users click.
Click-through rate: clicks divided by impressions.
Why it matters: Tells you if titles/snippets are compelling enough to earn the click.
Average ranking position of your pages in search.
Why it matters: Lower is better. Position gains usually lead to more traffic over time.
Unique people who visited your site during the selected period.
Why it matters: Measures audience reach, not just repeat activity.
Total visits, including multiple visits from the same user.
Why it matters: Reflects overall site demand and repeat engagement.
Share of sessions considered meaningfully engaged by GA4.
Why it matters: Shows whether traffic quality is improving, not just volume.
Number of key actions completed (lead, signup, purchase, etc.).
Why it matters: Connects traffic to business outcomes.
Start with the live demo, review a sample weekly report, then choose the plan that fits your site count.